
Seasonality and the Correlation with Days on Market


Credit for graphic: Chris Butterworth and Simple MLS Charts

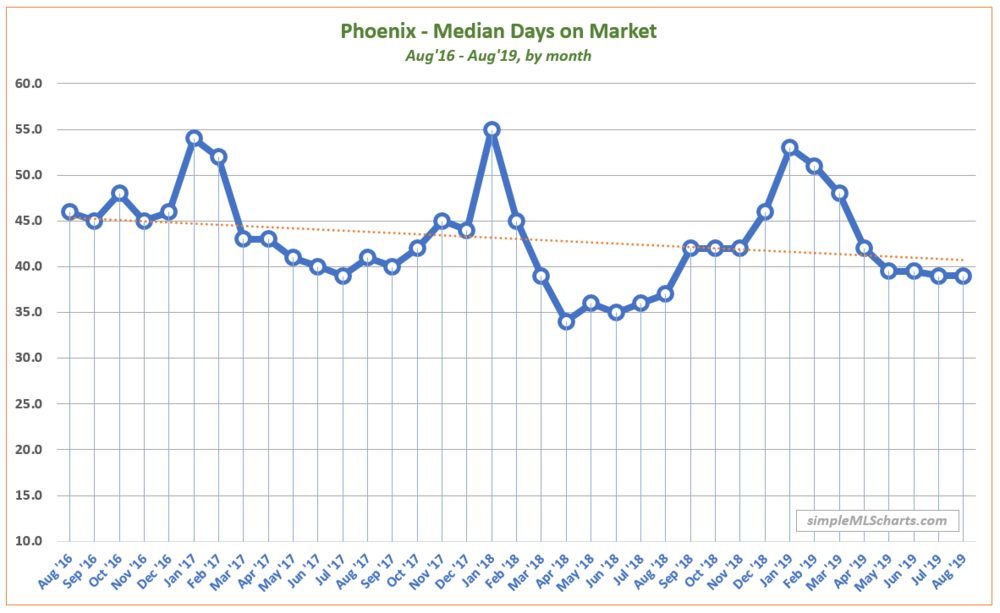
I ran across this great graphic that did a great job of telling the story of the seasonality in the Arizona Real Estate market and how it correlates to the days a house is on market before it is sold. There are a couple of things I want to point out before we jump into my thoughts on this. First, please take note that this is looking at the last 3 year’s trend. Second, by way of explanation, the orange downward sloping line is the trend line and the blue line with the dots are the actual data points that represent a recorded closing for each month. The dates are along the bottom and the days on market are noted on the left side of the chart. So with those items established, let’s jump into explaining what we are looking at here.

So as we are looking at the chart we can see a very gradual trend overall towards shorter days on market (orange line), but within that is some very obvious seasonality trends. Look at January closing numbers for each of the years. You can see that January closings are the closings that took the most days on market to accomplish and most of those were initiated in… wait for it… October (THIS MONTH!). So what does that mean to you if you are trying to “time the market” in regards to days on market? It means that if you list your house for sale in October you can expect it to take the most days (as compared to the rest of the year) to actually close and you can expect it to close between December and January.

Looking to get your house sold in the least amount of days? Well then we would tell you based on historical data that you want to sell your house between March and June and it will sell in the shortest amount of days on market.

Do these days on market mean anything more to you? Well historically yes. We have been able to track and see that there is a correlation between the days on market and the sales price as well. The longer a house is on the market the less that it sells for.

So a good agent will tell you that we need to price the house correctly right out of the gate in order to make you the most money - regardless of where you are in the seasonality of the market. A great agent will use great marketing and education to help you maximize your exposure and desirability within the market no matter what time of the year it is. Consult with your agent on when the best time for YOU to sell is based on your needs and goals and what you as the seller and what they as the agent are going to do to maximize all the opportunities in your needed time frame.

Please reach out to us with any questions you may have on this information or discuss your specific real estate questions and needs. We are here to be a resource to you and are never too busy to help or to help your referrals. Please visit us at www.Living48re.com for all of our great resources to help and educate.

Comments

Popular posts from this blog

Take Advantage of Your Home Equity: A Homeowner’s Guide

Homeownership offers many advantages over renting, including a stable living environment, predictable monthly payments, and the freedom to make modifications. Neighborhoods with high rates of homeownership have less crime and more civic engagement. Additionally, studies show that homeowners are happier and healthier than renters, and their children do better in school. 1 But one of the biggest perks of homeownership is the opportunity to build wealth over time. Researchers at the Urban Institute found that homeownership is financially beneficial for most families, 2 and a recent study showed that the median net worth of homeowners can be up to 80 times greater than that of renters in some areas. 3 So how does purchasing a home help you build wealth? And what steps should you take to maximize the potential of your investment? Find out how to harness the power of home equity for a secure financial future. WHAT IS HOME EQUITY? Home equity is the difference between...

Arizona Christmas Traditions

Here in the Evans Home we have a lot of Christmas season traditions. Arizona is definitely not your typical winter wonderland but I, for one, am extremely grateful to not have to shovel snow every morning. (Sorry Katelyn and Garrett, you chose to live in Utah, so that's your own fault). We thought it would be fun to share some of our Christmas traditions with you, and we want to know what your family's traditions are too! Make sure to comment below and let us know!! First, we want to share a few of our more comedic Arizona traditions. If you're not from Arizona, you will definitely find these comedic. If you ARE from Arizona you probably have seen these on every corner or in every house. Because where else are you going to put Santa hats in your front yard? With the average temperature in the valley being around 70 degrees during the day you're more likely to see a "fireplace" on a TV then actually being utilized in a home. If you ask us we ...

March Arizona Real Estate Market Update

It’s that time again for a “What’s Happening In the Market” blog!!! Each and every month I attend a Phoenix and ARMLS (Arizona Regional Multiple Listing Service) Market Update meeting where we review the previous month’s numbers and discuss the trends and seasonal fluctuations we see in the market. This blog is a quick recap of the information we discussed and I invite you to reach out to me with any questions you have or if you want to dive deeper into something. Market Factoids: Supply: 3.5 months - this number is down from the previous month Inventory: 91 days Active Days On Market: 99 days Closed Days On Market: 73 - up from the previous month Active $/SF: $224.64 - down from previous month Sold $/SF: $163.88 - up from the previous month Ave. Sold: $326,049.00 - up from the previous month Median Sold: $261,500.00 - up from the previous month As of the day we pulled the numbers there were 18,942 active listings in the MLS. This number is down by about 1% month over ...